Fig. 11
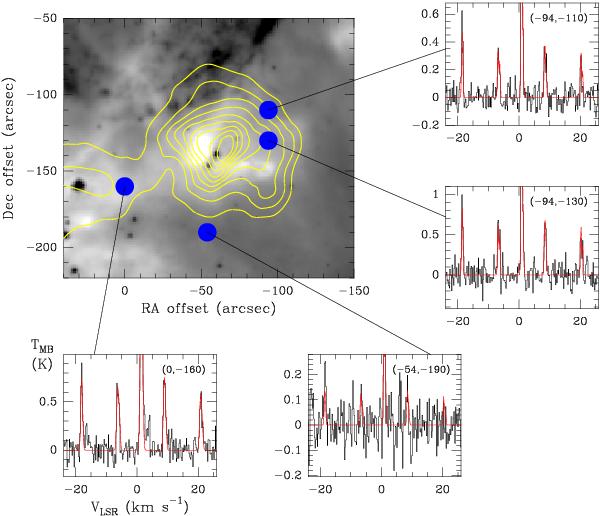
Anomalous spectra in the SW region. The greyscale displays the Spitzer/IRAC 8 μm emission, and the yellow contours the NH3 (1, 1) integrated emission. Blue dots mark the positions of the anomalous spectra. These spectra are shown in the smaller boxes outside the map. Offsets are indicated in the top right corner of each spectrum. The observed spectra are in black and the fitting in red. The TMB scale has been chosen to improve the visibility of satellite lines.
Current usage metrics show cumulative count of Article Views (full-text article views including HTML views, PDF and ePub downloads, according to the available data) and Abstracts Views on Vision4Press platform.
Data correspond to usage on the plateform after 2015. The current usage metrics is available 48-96 hours after online publication and is updated daily on week days.
Initial download of the metrics may take a while.