Fig. 2
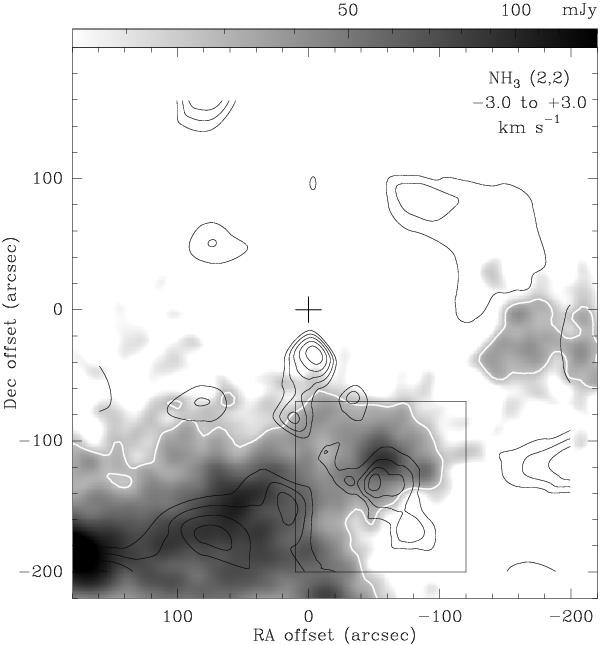
Same as Fig. 1 for the NH3 (2, 2) line. Contours start at 0.22 K km s-1, and are spaced by 0.11 K km s-1. Although the most extended emission is well correlated to the dark cloud in the south and west, the peak of the (2, 2) line arises from the (0″, −40″) position and is not correlated to the 1.2 mm emission.
Current usage metrics show cumulative count of Article Views (full-text article views including HTML views, PDF and ePub downloads, according to the available data) and Abstracts Views on Vision4Press platform.
Data correspond to usage on the plateform after 2015. The current usage metrics is available 48-96 hours after online publication and is updated daily on week days.
Initial download of the metrics may take a while.