Fig. 3
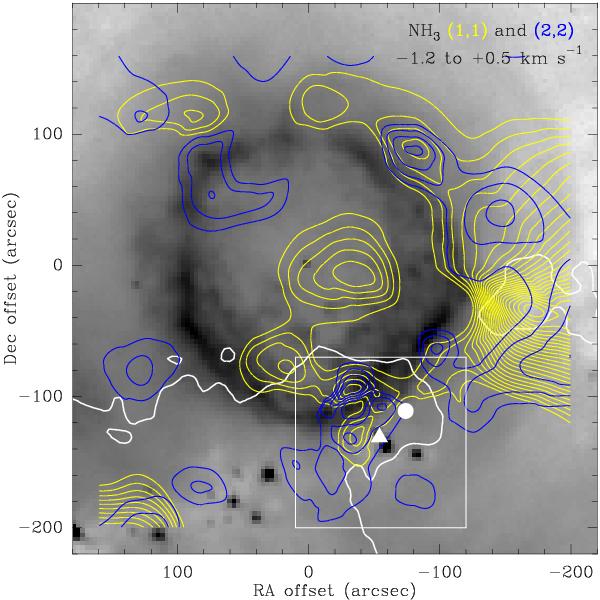
NH3 (1, 1) and (2, 2) integrated line emission in the velocity range (−1.2, +0.5) km s-1, overlaid on the 70 μm continuum of Herschel/PACS. The white contour is the same as depicted in Figs. 1 and 2. The fully sampled area is indicated by the white square. The white triangle (circle) points to the position of the NH3 (CO) peak. NH3(1, 1) starting and spacing contours (yellow) are 0.12 and 0.06 K km s-1, respectively. NH3(2, 2) starting and spacing contours (blue) are 0.04 K km s-1. In this velocity range, the ammonia emission is dominated by a ring-like structure towards the outer part of the ring nebula (see text).
Current usage metrics show cumulative count of Article Views (full-text article views including HTML views, PDF and ePub downloads, according to the available data) and Abstracts Views on Vision4Press platform.
Data correspond to usage on the plateform after 2015. The current usage metrics is available 48-96 hours after online publication and is updated daily on week days.
Initial download of the metrics may take a while.