Fig. 4
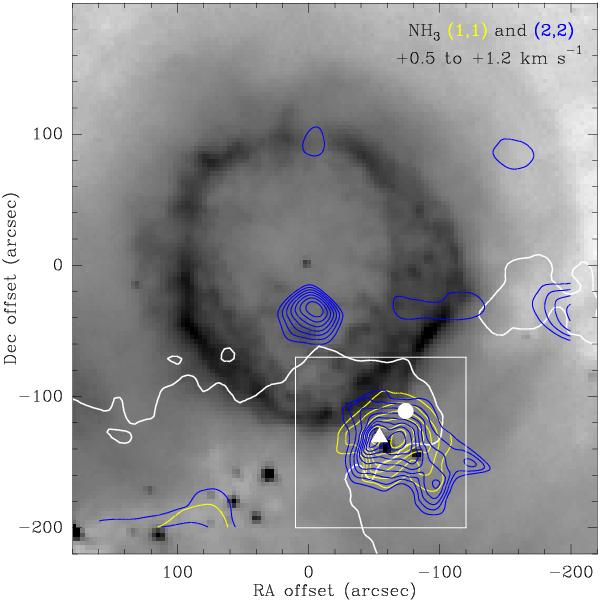
Same as Fig. 3, but for the the velocity range (+0.5, +1.2) km s-1. Starting contours and spacing of the NH3 (1, 1) line (yellow) are 0.6 K km s-1 and 0.2 K km s-1, respectively. For the NH3 (2, 2) line, the starting contours and spacing (blue) are 0.09 and 0.03 K km s-1, respectively. At this velocity range, the ammonia emission is particularly intense towards the SW region (e.g., within the white square), in coincidence with the most prominent CO emission. Another outstanding feature is the (2, 2) spot around (0″, −40″), which has no (1, 1) counterpart.
Current usage metrics show cumulative count of Article Views (full-text article views including HTML views, PDF and ePub downloads, according to the available data) and Abstracts Views on Vision4Press platform.
Data correspond to usage on the plateform after 2015. The current usage metrics is available 48-96 hours after online publication and is updated daily on week days.
Initial download of the metrics may take a while.