Fig. 5
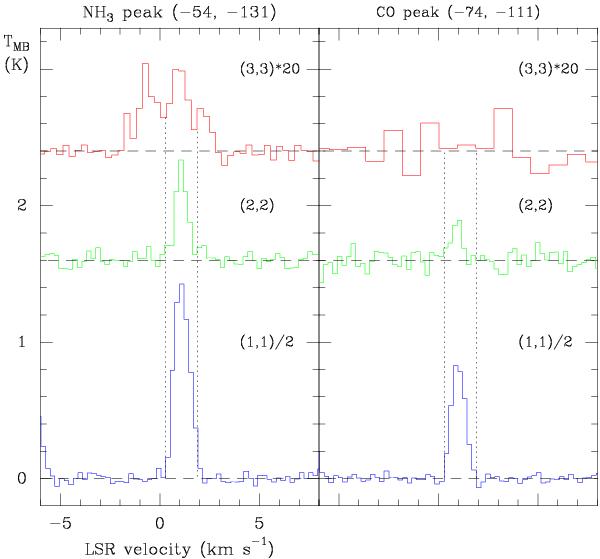
NH3 (3, 3) observations in the south-western part of the field. Two positions (the NH3 and the CO peaks) have been observed, indicated above the boxes. The (1, 1) and (2, 2) spectra towards the same positions are also plotted for comparison. Note that the (1, 1) intensity scale is reduced by a factor of two, and the (3, 3) spectra are multiplied by 20. The (3, 3) spectrum towards the CO peak has been smoothed to 0.7 km s-1. Dashed vertical lines are plotted at +0.3 and +1.9 km s-1 to facilitate further comparisons among the lines, and to separate the three components present in the (3, 3) line towards the NH3 peak.
Current usage metrics show cumulative count of Article Views (full-text article views including HTML views, PDF and ePub downloads, according to the available data) and Abstracts Views on Vision4Press platform.
Data correspond to usage on the plateform after 2015. The current usage metrics is available 48-96 hours after online publication and is updated daily on week days.
Initial download of the metrics may take a while.