Fig. 6
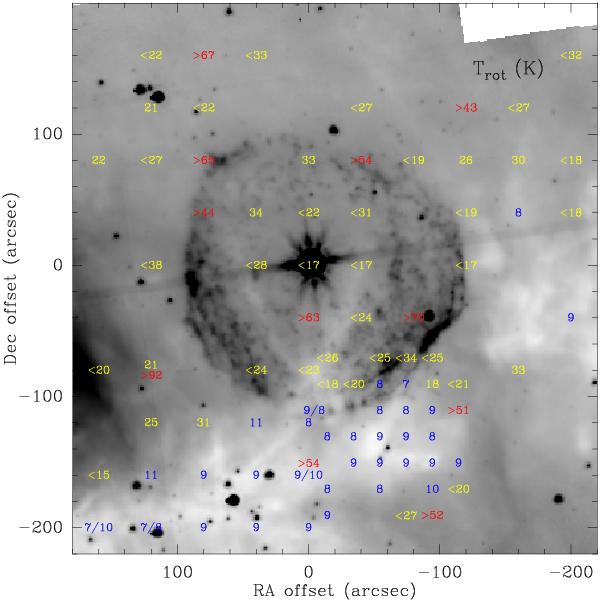
Distribution of the rotational temperatures, overlaid on the 8 μm image of Spitzer. The values derived from hyperfine fitting of the (1, 1) line are labelled in blue; those derived from Gaussian fitting of both lines are shown in yellow; red labels correspond to the positions with the highest values of Trot (see text). In all cases, fitting of the (2, 2) has been obtained with a single Gaussian component. The low temperatures associated with the IRDC, and higher values elsewhere are clearly revealed.
Current usage metrics show cumulative count of Article Views (full-text article views including HTML views, PDF and ePub downloads, according to the available data) and Abstracts Views on Vision4Press platform.
Data correspond to usage on the plateform after 2015. The current usage metrics is available 48-96 hours after online publication and is updated daily on week days.
Initial download of the metrics may take a while.