Fig. 9
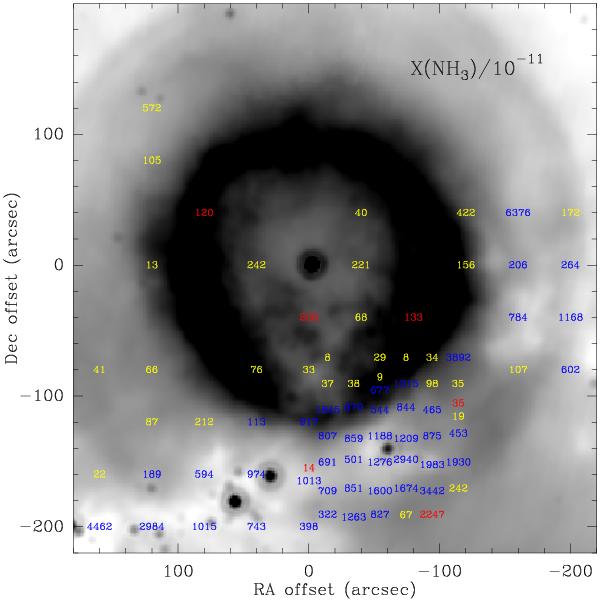
Distribution of the ammonia abundances in units of 10-11 overlaid on an image of Spitzer/MIPS at 24 μm to highlight the second infrared ring. See details of the computation of H2 column densities in the text. Considerable differences between the IRDC and the rest of the field are again noted; furthermore, high values appear in the northern and south edges of the SW region, coinciding with the position of the first and second infrared rings, respectively (see text).
Current usage metrics show cumulative count of Article Views (full-text article views including HTML views, PDF and ePub downloads, according to the available data) and Abstracts Views on Vision4Press platform.
Data correspond to usage on the plateform after 2015. The current usage metrics is available 48-96 hours after online publication and is updated daily on week days.
Initial download of the metrics may take a while.