Free Access
Fig. 28
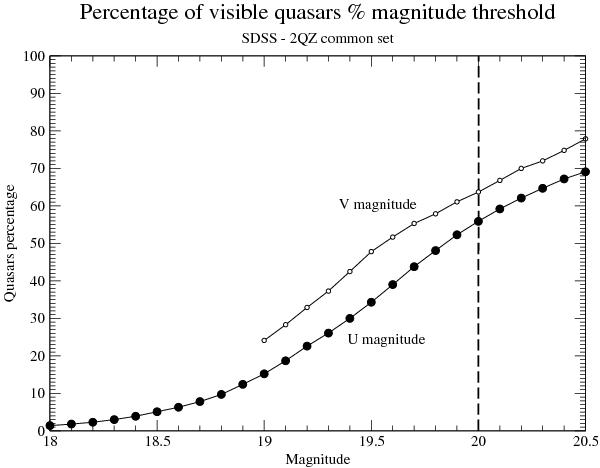
Percentage of quasars found at a given magnitude threshold in a dense selected sky area, in V and U bands, respectively, with respect to the total number of qusars detected. The dashed vertical line corresponds to the GAIA cut-off in V band.
Current usage metrics show cumulative count of Article Views (full-text article views including HTML views, PDF and ePub downloads, according to the available data) and Abstracts Views on Vision4Press platform.
Data correspond to usage on the plateform after 2015. The current usage metrics is available 48-96 hours after online publication and is updated daily on week days.
Initial download of the metrics may take a while.