Fig. 3
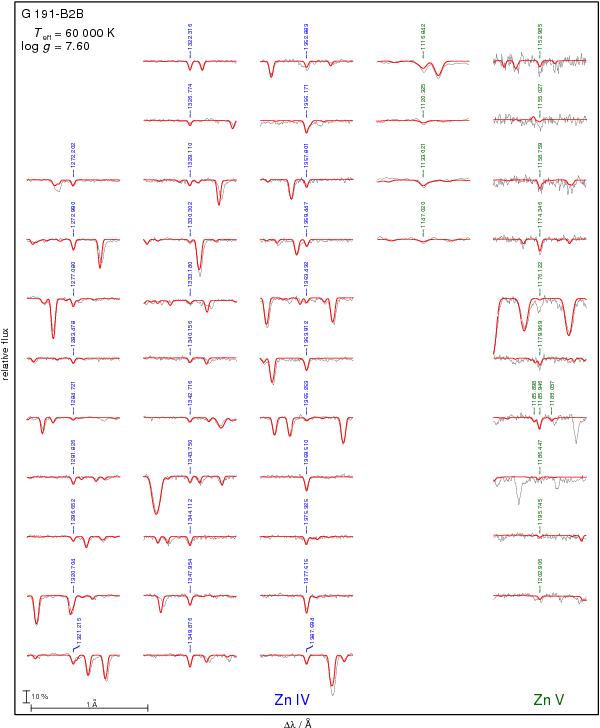
Zn iv lines (left panel, marked with their wavelengths in Å, blue in the online version) and Zn v lines (right panel, marked in green) in the FUSE (for lines at λ < 1150 Å) and HST/STIS (λ > 1150 Å) observations of G191−B2B compared with our theoretical line profiles. For the identification of other lines, see Rauch et al. (2013). The vertical bar shows 10% of the continuum flux.
Current usage metrics show cumulative count of Article Views (full-text article views including HTML views, PDF and ePub downloads, according to the available data) and Abstracts Views on Vision4Press platform.
Data correspond to usage on the plateform after 2015. The current usage metrics is available 48-96 hours after online publication and is updated daily on week days.
Initial download of the metrics may take a while.