Fig. 5
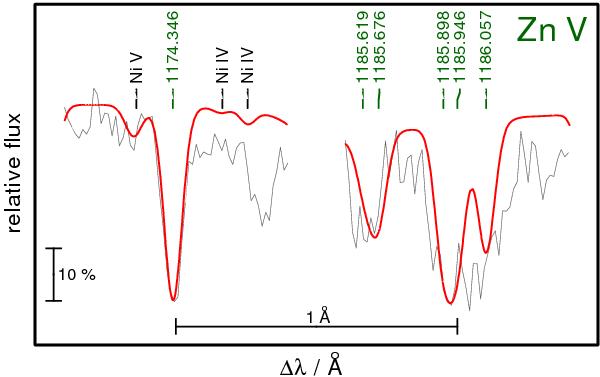
Theoretical line profiles of the strongest Zn v lines calculated from our model of RE 0503−289 with a Zn abundance of 2.7 × 10⁻⁴ (mass fraction) located in the FUSE wavelength range compared with the observation. The lines are shifted to the observation, see Table 5.
Current usage metrics show cumulative count of Article Views (full-text article views including HTML views, PDF and ePub downloads, according to the available data) and Abstracts Views on Vision4Press platform.
Data correspond to usage on the plateform after 2015. The current usage metrics is available 48-96 hours after online publication and is updated daily on week days.
Initial download of the metrics may take a while.