Fig. 16
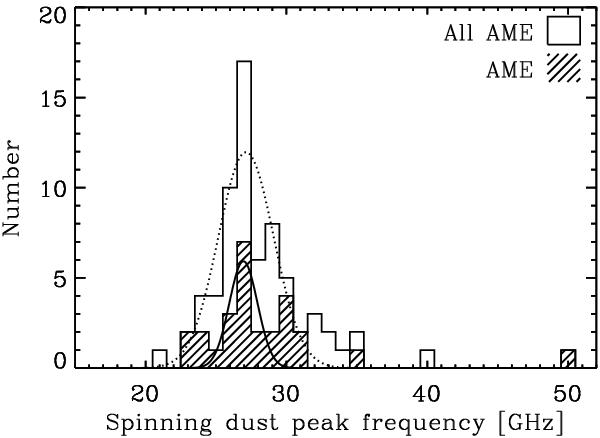
Histogram of spinning dust peak frequencies, νsp. The unfilled histogram is for both AME and semi-significant AME regions, while the hatched region is for the AME sources only. The best-fitting Gaussians for these two histograms are overplotted. The source at νsp = 50 GHz is G160.60−12.05 (California nebula).
Current usage metrics show cumulative count of Article Views (full-text article views including HTML views, PDF and ePub downloads, according to the available data) and Abstracts Views on Vision4Press platform.
Data correspond to usage on the plateform after 2015. The current usage metrics is available 48-96 hours after online publication and is updated daily on week days.
Initial download of the metrics may take a while.