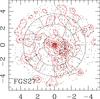
Fig. 1
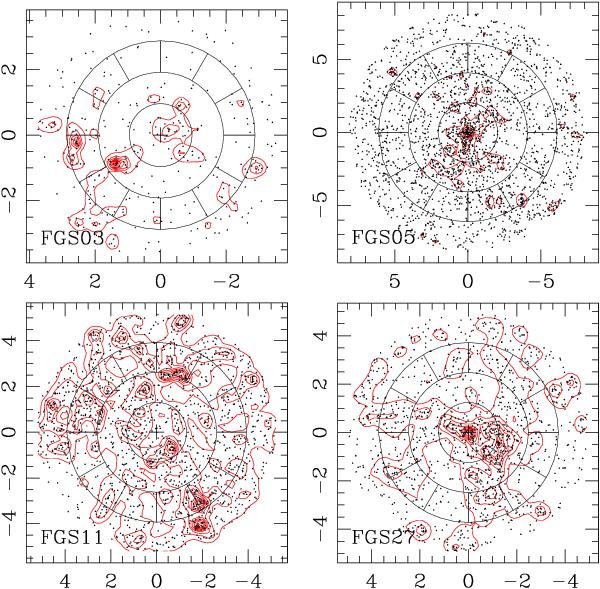
Projected spatial distribution and 2D-DEDICA isodensity contours of SDSS galaxies with | (r − i) − (r − i)BCG | ≤ 0.2 and Mr< − 19 in a few FGSs spanning a wide range of appearances (see text). The plots are centered on the S07 BCGs (marked with black crosses). The inner circle encloses the region within R200. The outer two circles enclose the regions within 2R200 and 3R200. The sectors used for the computation of the local field are displayed. Units on the axes are in  Mpc.
Mpc.
Current usage metrics show cumulative count of Article Views (full-text article views including HTML views, PDF and ePub downloads, according to the available data) and Abstracts Views on Vision4Press platform.
Data correspond to usage on the plateform after 2015. The current usage metrics is available 48-96 hours after online publication and is updated daily on week days.
Initial download of the metrics may take a while.