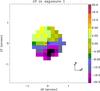
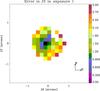
Fig. 3
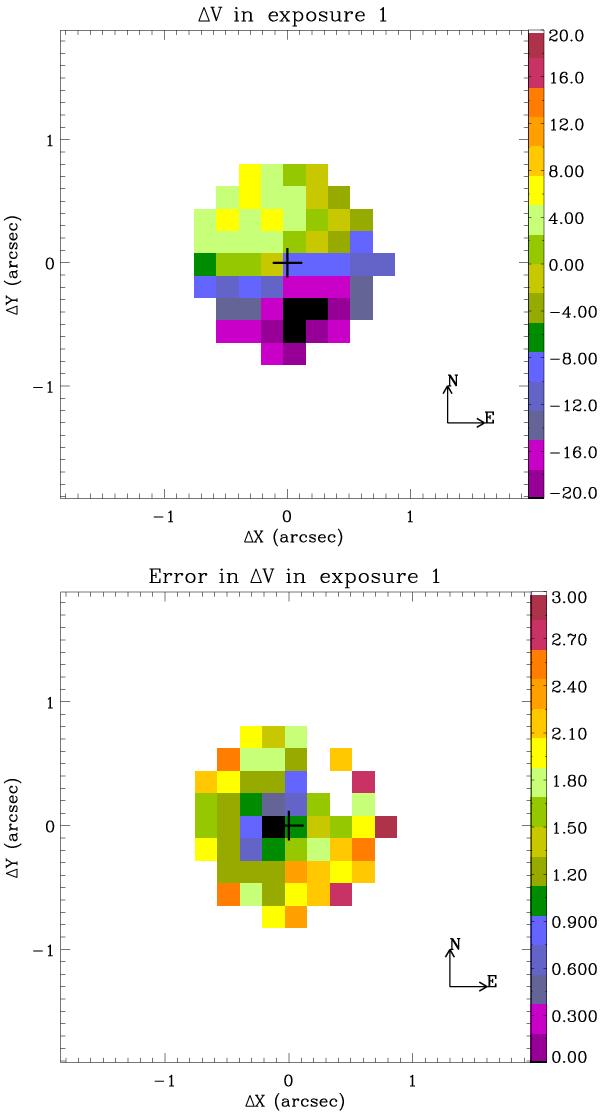
Top: shift in velocity obtained from a cross-correlation of the P Cygni profile between the spectrum at the position of the star and each individual spectra in the field, for exposure 1. Color scale is km s-1. The continuum emission center is marked as a black cross. The physical orientation is also given. Bottom: error in the shift also in km s-1.
Current usage metrics show cumulative count of Article Views (full-text article views including HTML views, PDF and ePub downloads, according to the available data) and Abstracts Views on Vision4Press platform.
Data correspond to usage on the plateform after 2015. The current usage metrics is available 48-96 hours after online publication and is updated daily on week days.
Initial download of the metrics may take a while.