Free Access
Fig. 11
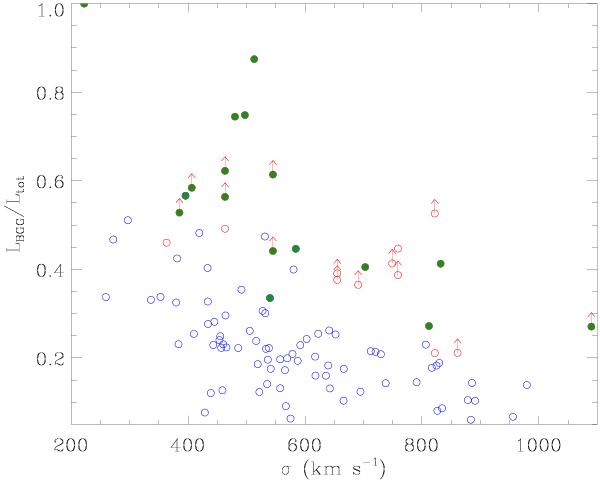
Fraction of light of the BGG as function of the LOS velocity dispersion (mass) of the system. The symbols and colors are the same as in Fig. 10. Upward arrows indicate those systems for which the magnitude gaps (and thus the LBGG/Ltot) represent lower limits.
Current usage metrics show cumulative count of Article Views (full-text article views including HTML views, PDF and ePub downloads, according to the available data) and Abstracts Views on Vision4Press platform.
Data correspond to usage on the plateform after 2015. The current usage metrics is available 48-96 hours after online publication and is updated daily on week days.
Initial download of the metrics may take a while.