Free Access
Fig. 7
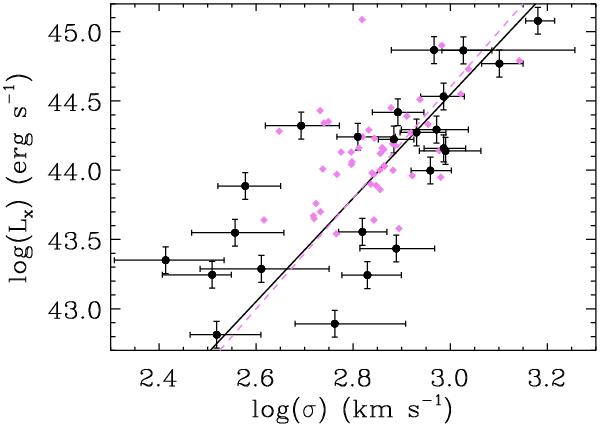
LX − σv relation for the FG candidates for which we were able to determine a velocity dispersion. The black circles represent our data and violet diamonds are taken from Cava et al. (2009) for comparison. The solid black line is our best fit and the dashed violet line is the best fit from Cava et al. (2009).
Current usage metrics show cumulative count of Article Views (full-text article views including HTML views, PDF and ePub downloads, according to the available data) and Abstracts Views on Vision4Press platform.
Data correspond to usage on the plateform after 2015. The current usage metrics is available 48-96 hours after online publication and is updated daily on week days.
Initial download of the metrics may take a while.