Fig. 1
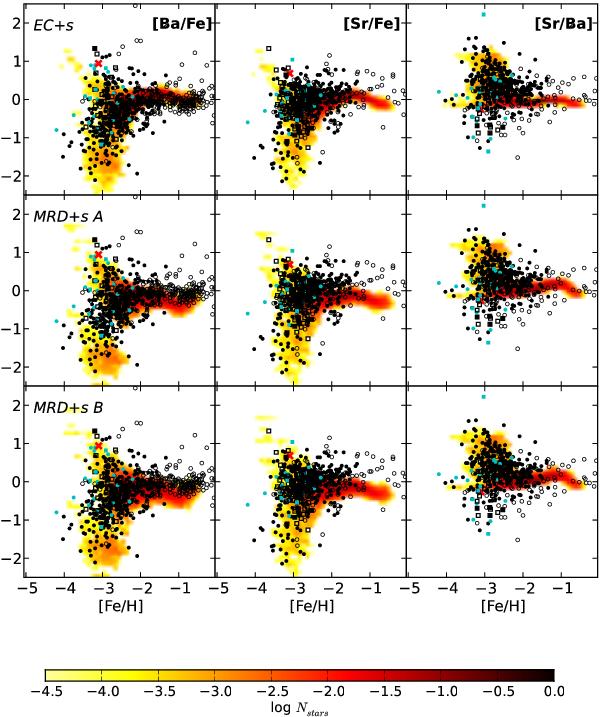
Stellar distribution. From the left [Ba/Fe], [Sr/Fe] and [Sr/Ba] vs. [Fe/H] in the halo; the density plot is the distribution of simulated long-living stars for our models, see bar below the main figure for the color scale; superimposed, we show the abundances ratios for halo stars (data from Frebel 2010; Aoki et al. 2013a). The symbols for the Frebel (2010) data are black dots for normal stars, cyan dots for CEMP-no, a red x marker for the CEMP-r star, and black open circle for stars without carbon measurement; for the Aoki et al. (2013a) data we adopt the same symbols, but instead of dots we used squares.

Current usage metrics show cumulative count of Article Views (full-text article views including HTML views, PDF and ePub downloads, according to the available data) and Abstracts Views on Vision4Press platform.
Data correspond to usage on the plateform after 2015. The current usage metrics is available 48-96 hours after online publication and is updated daily on week days.
Initial download of the metrics may take a while.