Free Access
Fig. 2
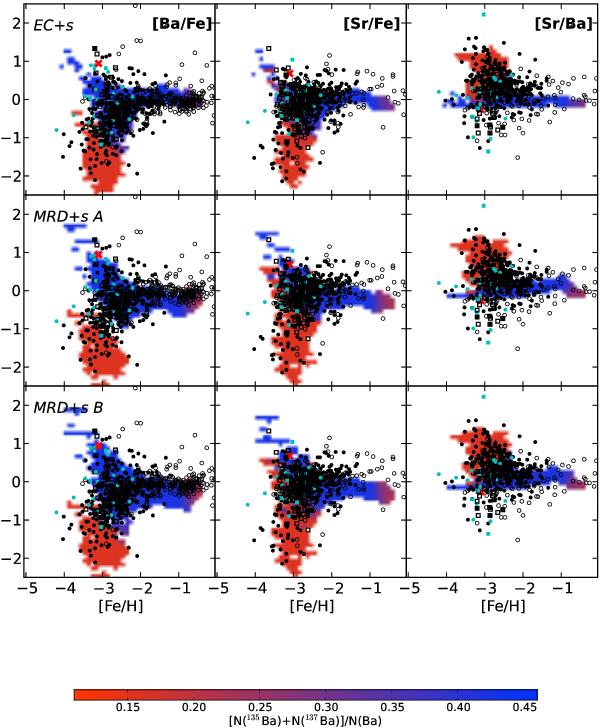
Barium isotopic ratio. From the left [Ba/Fe], [Sr/Fe] and [Sr/Ba] vs. [Fe/H] in the halo. The density plot is the distribution of the isotopic ratio of Ba according to the models, see the bar below the main figure. The data are the same as in Fig. 1.
This figure is made of several images, please see below:

Current usage metrics show cumulative count of Article Views (full-text article views including HTML views, PDF and ePub downloads, according to the available data) and Abstracts Views on Vision4Press platform.
Data correspond to usage on the plateform after 2015. The current usage metrics is available 48-96 hours after online publication and is updated daily on week days.
Initial download of the metrics may take a while.