Free Access
Fig. 5
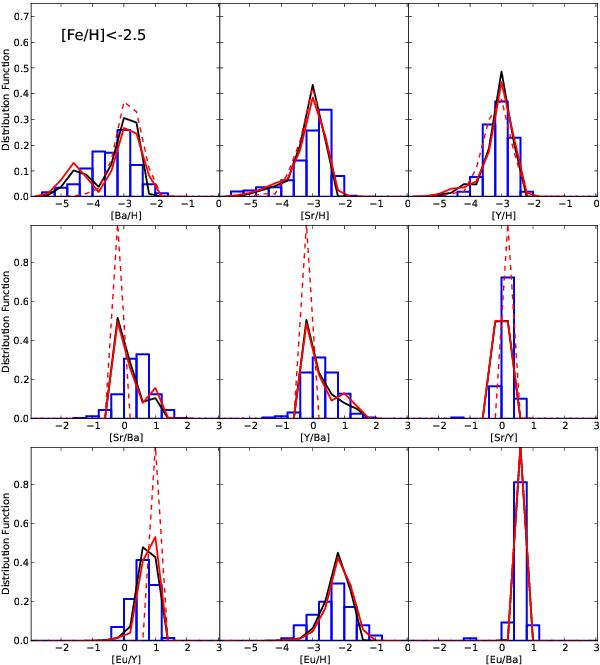
Distribution functions of observed (blue histograms) and simulated stars in the range [Fe/H] < − 2.5. We consider nine different chemical abundance ratios. Three different models are plotted: EC+s (black line), MRD+s B2 (red line) and MRD-s B2 (without contribution of spinstars, dashed red line).
Current usage metrics show cumulative count of Article Views (full-text article views including HTML views, PDF and ePub downloads, according to the available data) and Abstracts Views on Vision4Press platform.
Data correspond to usage on the plateform after 2015. The current usage metrics is available 48-96 hours after online publication and is updated daily on week days.
Initial download of the metrics may take a while.