Free Access
Fig. 5
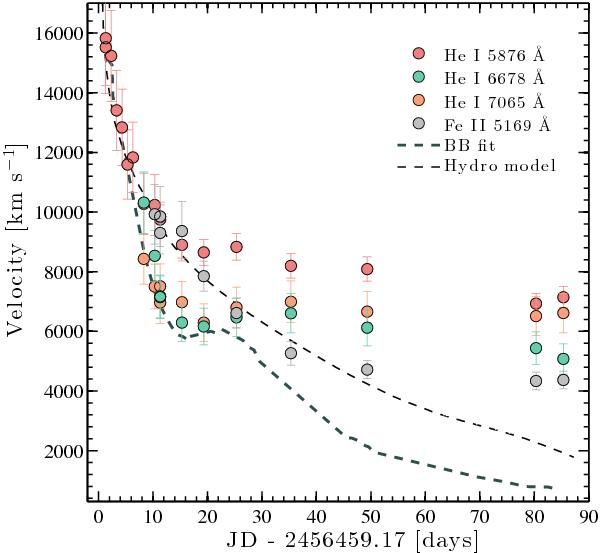
Line velocities of iPTF13bvn derived from absorption minima in the spectra (colored circles), the photospheric velocity derived from BB fits to the photometry (thick dashed line) and the photospheric velocity of iPTF13bvn modeled by our hydrodynamical code (thin dashed line).
Current usage metrics show cumulative count of Article Views (full-text article views including HTML views, PDF and ePub downloads, according to the available data) and Abstracts Views on Vision4Press platform.
Data correspond to usage on the plateform after 2015. The current usage metrics is available 48-96 hours after online publication and is updated daily on week days.
Initial download of the metrics may take a while.