Fig. 6
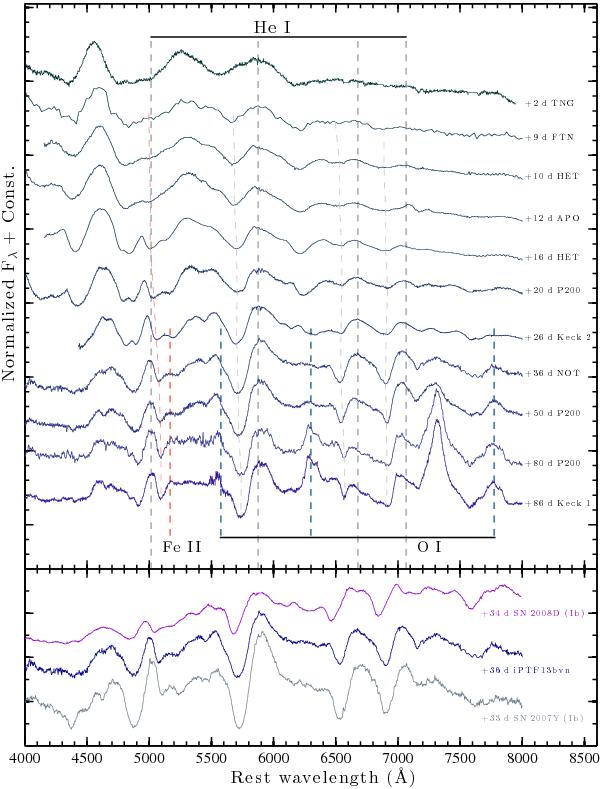
Spectral evolution of iPTF13bvn in the wavelength range 4000−8000 Å (top panel). Comparison of the visible spectra of iPTF13bvn to those of other SNe Ib at approximately 35 d past the explosion (bottom panel). Thick dashed lines mark the central wavelength of the marked emission lines at rest. Thin dashed lines mark the absorption minima associated with the emission lines derived from Gaussian fits to the absorption features. The spectra up to 16 d past the explosion have been selected from the early spectral sequence presented by Cao et al. (2013).
Current usage metrics show cumulative count of Article Views (full-text article views including HTML views, PDF and ePub downloads, according to the available data) and Abstracts Views on Vision4Press platform.
Data correspond to usage on the plateform after 2015. The current usage metrics is available 48-96 hours after online publication and is updated daily on week days.
Initial download of the metrics may take a while.