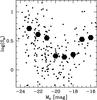
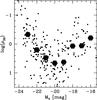
Fig. 1
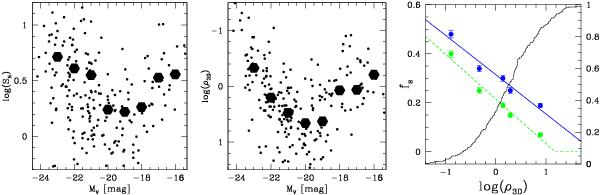
GC specific frequencies and galaxy mass densities define similar U-shape relations with MV. Left: logarithm of the specific frequency, SN, of GCs plotted vs. the host galaxy luminosity, MV. The sample is taken from the compilation of Harris et al. (2013), but restricted to early-type galaxies (E/SO, dE/SO) for which dynamical mass estimates exist. We also indicate the mean SN in bins of one magnitude (thick hexagons). Middle: logarithm of the projected 3D mass density within the half-light radius, ρ3D, plotted vs. MV for the same sample as in the left panel. The units of the mass density are pc -3. Right: survival fraction, fS, of GCs with masses > after 10 Gyr of evolution plotted vs. the logarithm of the projected 3D mass density, ρ3D, within the half-light radius of their host galaxy. The data are based on the simulations presented in Brockamp et al. (2014). The blue filled circles (fit by a solid blue line) correspond to the assumption of an isotropic GC velocity distribution, whereas the green filled circles (fit by a dashed green line) correspond to a modestly radially biased GC configuration. From the high to low survival fraction, the data correspond to the following template simulations: NGC 4889, VCC 1073, IC 1459, NGC 4494, and NGC 4564 (see also the summary in Table 1). The solid black curve shows the cumulative ρ3D distribution of the sample of early type galaxies considered in the left and middle panels.
Current usage metrics show cumulative count of Article Views (full-text article views including HTML views, PDF and ePub downloads, according to the available data) and Abstracts Views on Vision4Press platform.
Data correspond to usage on the plateform after 2015. The current usage metrics is available 48-96 hours after online publication and is updated daily on week days.
Initial download of the metrics may take a while.