Fig. 2
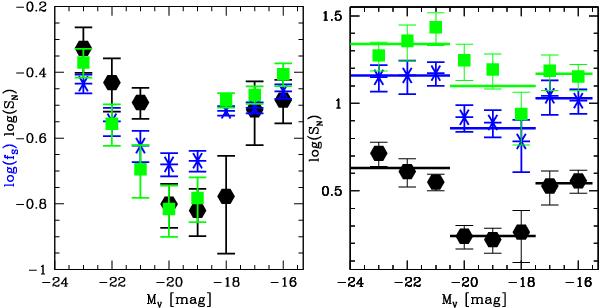
How tidal erosion changes the relation between GC specific frequency SN and galaxy luminosity MV. Left: we compare the observed GC specific frequencies, SN (offset by a constant factor), with the predicted GC survival fractions, fS, for the same set of galaxies from Fig. 1, using the predictions from Eqs. (1) and (2). Large symbols indicate means within 1 mag bins. The observed SN are indicated in (black) hexagons, survival fractions in (blue) asterisks for isotropic orbits and in (green) squares for radially anisotropic orbits. Right: predicted primordial specific frequencies are obtained by dividing the observed specific frequencies by the survival fractions of the left panel. Colours and symbols as in the left panel. Black hexagons are again the observed present-day specific frequencies. The U-shape is attenuated for the isotropic case and is almost erased for the anisotropic case, see text for details. Horizontal thick lines denote the average SN values within the three luminosity ranges considered, MV = [−24.5:− 20.5] (high luminosity), MV = [−20.5:− 17.5] (intermediate luminosity), MV = [−17.5:− 15.5] (low luminosity).
Current usage metrics show cumulative count of Article Views (full-text article views including HTML views, PDF and ePub downloads, according to the available data) and Abstracts Views on Vision4Press platform.
Data correspond to usage on the plateform after 2015. The current usage metrics is available 48-96 hours after online publication and is updated daily on week days.
Initial download of the metrics may take a while.