Fig. 1
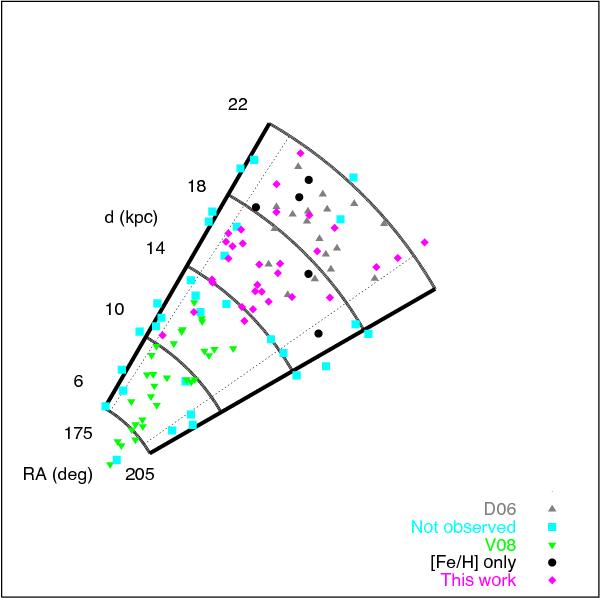
Distribution of the QUEST RRLS in the sky. The radial direction shows distance from the Sun (d), while the angular direction corresponds to right ascension (RA). Different symbols show the 3 data sets we are using in this work. It can be seen that the new observations (diamond symbols) fill the gap in distance between the samples of Duffau et al. (2006, D06) and Vivas et al. (2008, V08). The square and circle symbols indicate those RRLS for which we did not obtain spectroscopic observations or we were not able to measure a radial velocity. We concentrate our analysis in the region between the two dotted radial lines (178° < RA < 200°), in which we have phase space information for most of the QUEST RRLS.
Current usage metrics show cumulative count of Article Views (full-text article views including HTML views, PDF and ePub downloads, according to the available data) and Abstracts Views on Vision4Press platform.
Data correspond to usage on the plateform after 2015. The current usage metrics is available 48-96 hours after online publication and is updated daily on week days.
Initial download of the metrics may take a while.