Fig. 14
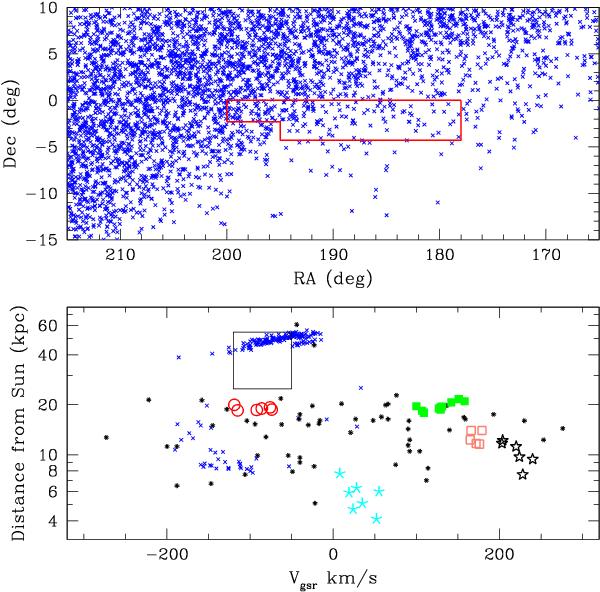
Top: distribution in the sky around Virgo of the Sgr debris in the models of Law & Majewski (2010). The polygon indicates the region studied in this work. Bottom: velocity and distance of model particles (crosses) and RRLS (asterisks) within the box indicated above. Stars in each one of the 5 kinematical groups detected here are shown with their corresponding symbol (Table 8). The two RRLS at distances >40 kpc were taken from Vivas et al. (2005). Rectangle indicates the approximate location of another kinematical group found by Brink et al. (2010) and Casey et al. (2012).
Current usage metrics show cumulative count of Article Views (full-text article views including HTML views, PDF and ePub downloads, according to the available data) and Abstracts Views on Vision4Press platform.
Data correspond to usage on the plateform after 2015. The current usage metrics is available 48-96 hours after online publication and is updated daily on week days.
Initial download of the metrics may take a while.