Fig. 1
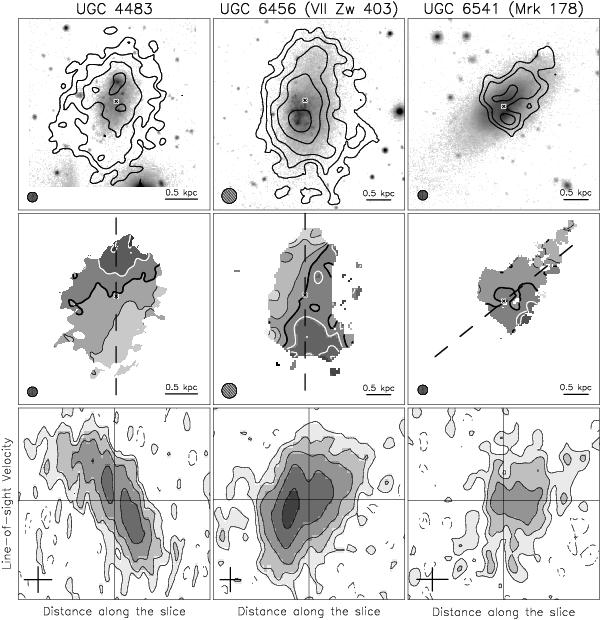
Examples of BCDs with different H I distribution and kinematics: UGC 4483 (left) has a regularly rotating H I disk, UGC 6456 (center) has a kinematically disturbed H I disk, and UGC 6456 (right) has an unsettled H I distribution. Top: optical image superimposed with the total H I map (contours). The contours are the same as in Appendix C. The cross shows the optical center; the circle shows the H I beam. Middle: H I velocity field. Light and dark shading indicate approaching and receding velocities, respectively. The thick, black line shows the systemic velocity. The isovelocity contours are the same as in Appendix C. The dashed line indicates the H I major axis. The cross and the circle are the same as in the top panel. Bottom: position-velocity diagrams taken along the major axis. The cross corresponds to 0.5 kpc × 10 km s-1. The horizontal and vertical lines indicate the systemic velocity and the galaxy center, respectively.
Current usage metrics show cumulative count of Article Views (full-text article views including HTML views, PDF and ePub downloads, according to the available data) and Abstracts Views on Vision4Press platform.
Data correspond to usage on the plateform after 2015. The current usage metrics is available 48-96 hours after online publication and is updated daily on week days.
Initial download of the metrics may take a while.