Fig. 10
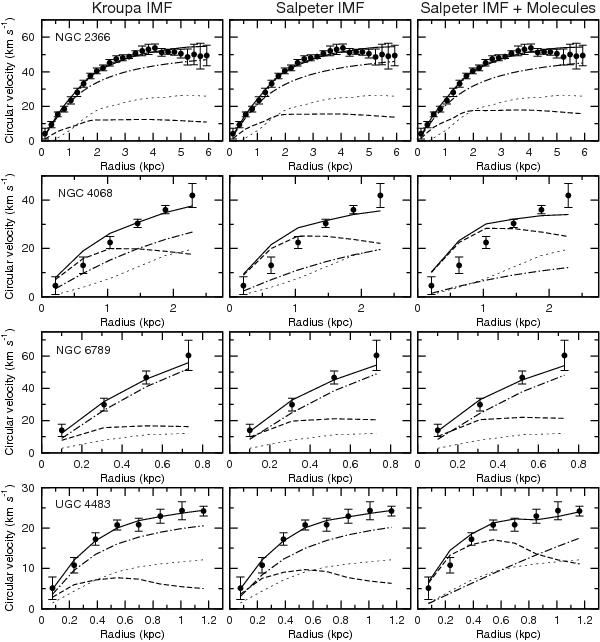
Rotation curve decompositions. Dots show the observed rotation curve (corrected for asymmetric-drift). Long-dashed, short-dashed, and dot-dashed lines show the gravitational contribution due to stars, atomic gas, and dark matter, while the solid line shows the resulting total contribution to the rotation curve. See Sect. 7.3 for details.
Current usage metrics show cumulative count of Article Views (full-text article views including HTML views, PDF and ePub downloads, according to the available data) and Abstracts Views on Vision4Press platform.
Data correspond to usage on the plateform after 2015. The current usage metrics is available 48-96 hours after online publication and is updated daily on week days.
Initial download of the metrics may take a while.