Fig. 12
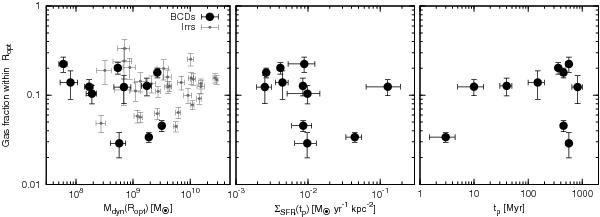
Left: the atomic gas fractions fgas = 1.33
MH I
/Mdyn versus
Mdyn calculated within the optical
radius Ropt. Large, black dots and small,
grey dots indicate BCDs (this work) and Irrs (Swaters et al. 2009), respectively. Middle:
fgas versus the SFR surface density
 where SFRp is the peak SFR over
the last 1 Gyr (see Table 1).
Right: fgas versus the look-back time
tp at SFRp.
where SFRp is the peak SFR over
the last 1 Gyr (see Table 1).
Right: fgas versus the look-back time
tp at SFRp.
Current usage metrics show cumulative count of Article Views (full-text article views including HTML views, PDF and ePub downloads, according to the available data) and Abstracts Views on Vision4Press platform.
Data correspond to usage on the plateform after 2015. The current usage metrics is available 48-96 hours after online publication and is updated daily on week days.
Initial download of the metrics may take a while.