Fig. 3
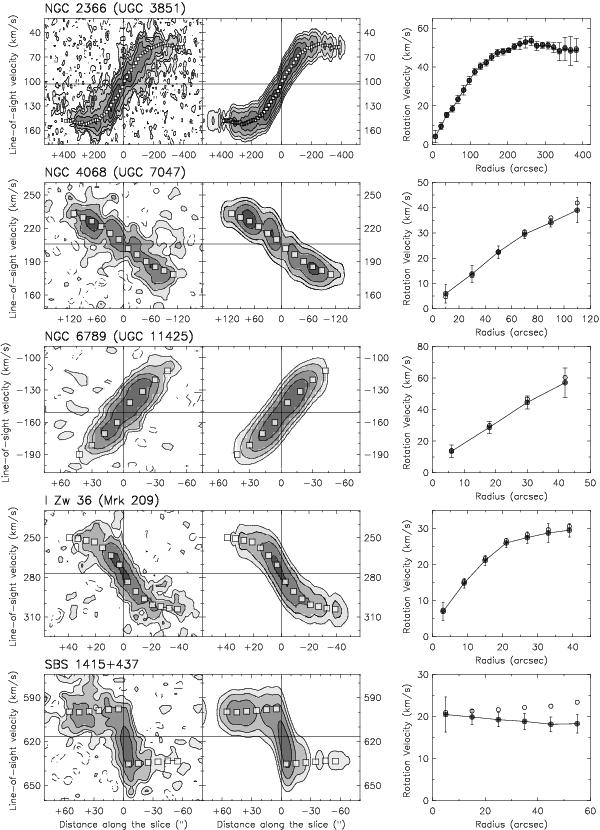
Kinematical analysis of five BCDs with a regularly rotating H I disk. Left: PV-diagrams obtained along the disk major axis from the observed cube and the model-cube. Contours are at −1.5 (dashed), 1.5, 3, 6, 12σ. The squares show the rotation curve used to build the models, projected along the line of sight. Right: observed rotation curve (filled circles) and asymmetric-drift-corrected rotation curve (open circles). See Sect. 5 for details.
Current usage metrics show cumulative count of Article Views (full-text article views including HTML views, PDF and ePub downloads, according to the available data) and Abstracts Views on Vision4Press platform.
Data correspond to usage on the plateform after 2015. The current usage metrics is available 48-96 hours after online publication and is updated daily on week days.
Initial download of the metrics may take a while.