Free Access
Fig. 3
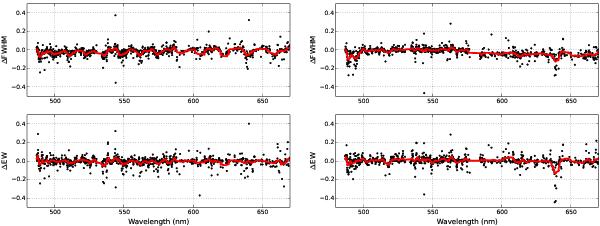
Relative difference in FWHM (upper part) and equivalent widths (lower part) for the δ Eri spectrum, with the moving average overplotted (red) for visual guidance. The numeric details of the HARPS against NARVAL (left plot) and HARPS against UVES-POP (right plot) comparisons can be found in Table 10.
Current usage metrics show cumulative count of Article Views (full-text article views including HTML views, PDF and ePub downloads, according to the available data) and Abstracts Views on Vision4Press platform.
Data correspond to usage on the plateform after 2015. The current usage metrics is available 48-96 hours after online publication and is updated daily on week days.
Initial download of the metrics may take a while.