Fig. 6
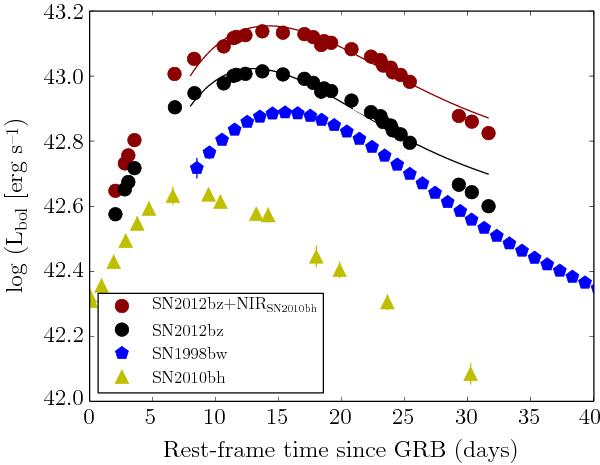
Pseudo-bolometric light curves of SN 2012bz from direct integration of the SED over g′r′i′z′ filters, and after including a NIR contribution as found for SN 2010bh. For comparison, the UBVRI light curve of SN 1998bw (Clocchiatti et al. 2011) and the g′r′i′z′JH light curve of SN 2010bh are shown (Olivares et al. 2012). The models for SN 2012bz are shown as solid lines. Early light-curve time data are not fitted as the analytical model does not account for other non-negligible sources of luminosity at these times (Sect. 3.3.3). Only photometric and calibration uncertainties are included in the error bars, which are usually smaller than the size of the plot symbol.
Current usage metrics show cumulative count of Article Views (full-text article views including HTML views, PDF and ePub downloads, according to the available data) and Abstracts Views on Vision4Press platform.
Data correspond to usage on the plateform after 2015. The current usage metrics is available 48-96 hours after online publication and is updated daily on week days.
Initial download of the metrics may take a while.