Fig. 3
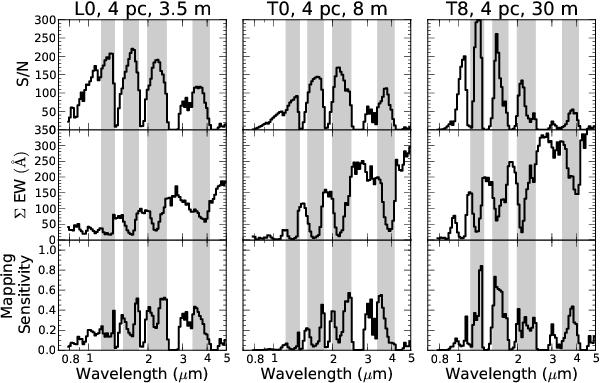
Doppler imaging sensitivity analyses for three representative cases: an L0 dwarf observed with a 3.5 m telescope (left), a T0 with an 8 m telescope (center), and a T8 with a 30 m telescope (right), all located 4 pc away. From bottom to top, the plots show (in 0.02λ bins) the median S/N, total equivalent width of absorption lines, and the normalized product of these quantities. The root sum square of this last quantity over observable wavelengths determines the final Doppler imaging sensitivity of a given instrument. The gray regions indicate the wavelength regions used to calculate the magnitude limits shown in Fig. 4.
Current usage metrics show cumulative count of Article Views (full-text article views including HTML views, PDF and ePub downloads, according to the available data) and Abstracts Views on Vision4Press platform.
Data correspond to usage on the plateform after 2015. The current usage metrics is available 48-96 hours after online publication and is updated daily on week days.
Initial download of the metrics may take a while.