Fig. 17
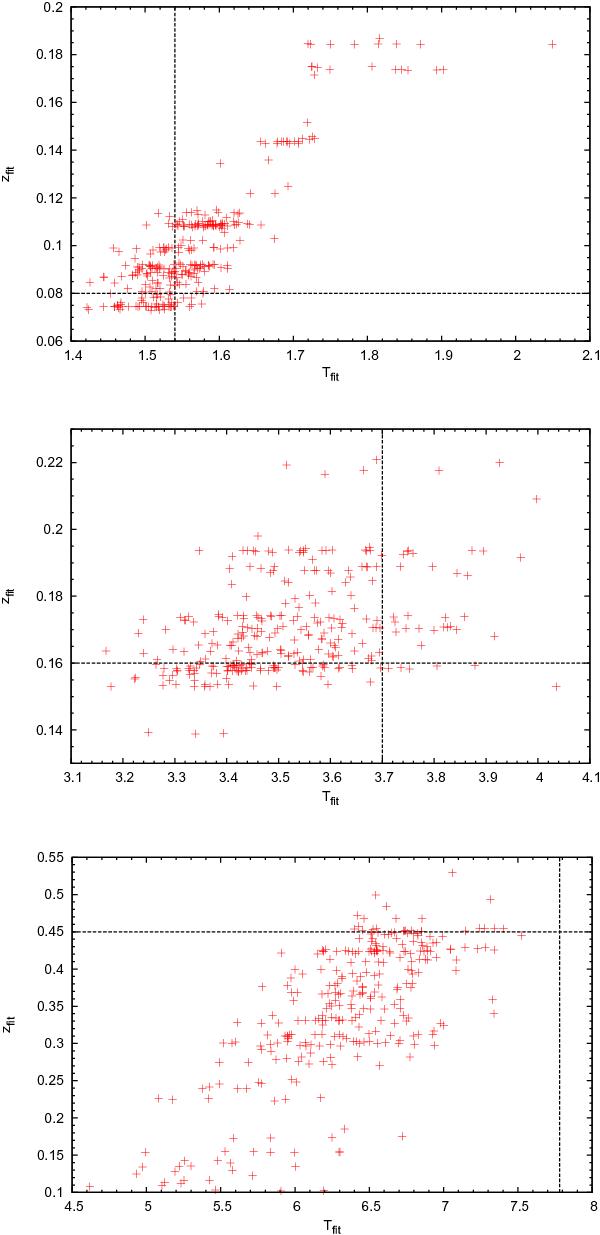
Distribution of the best-fit temperatures and redshifts for three different clusters in the deep exposure fields, each with roughly 5000 counts, but with different cluster masses and temperatures. From top to bottom: log (M/M⊙) = 13.75log (M/M⊙) = 14.35, log (M/M⊙) = 14.8. The horizontal and vertical lines indicate the input redshifts and temperatures, respectively. The low and high mass parameter set is rejected from the analysis due to large numbers of catastrophic failures. For these cluster masses, the correlation between the fit values of the temperature and the redshift emphasises the degeneracy between these two properties.
Current usage metrics show cumulative count of Article Views (full-text article views including HTML views, PDF and ePub downloads, according to the available data) and Abstracts Views on Vision4Press platform.
Data correspond to usage on the plateform after 2015. The current usage metrics is available 48-96 hours after online publication and is updated daily on week days.
Initial download of the metrics may take a while.