Fig. 8
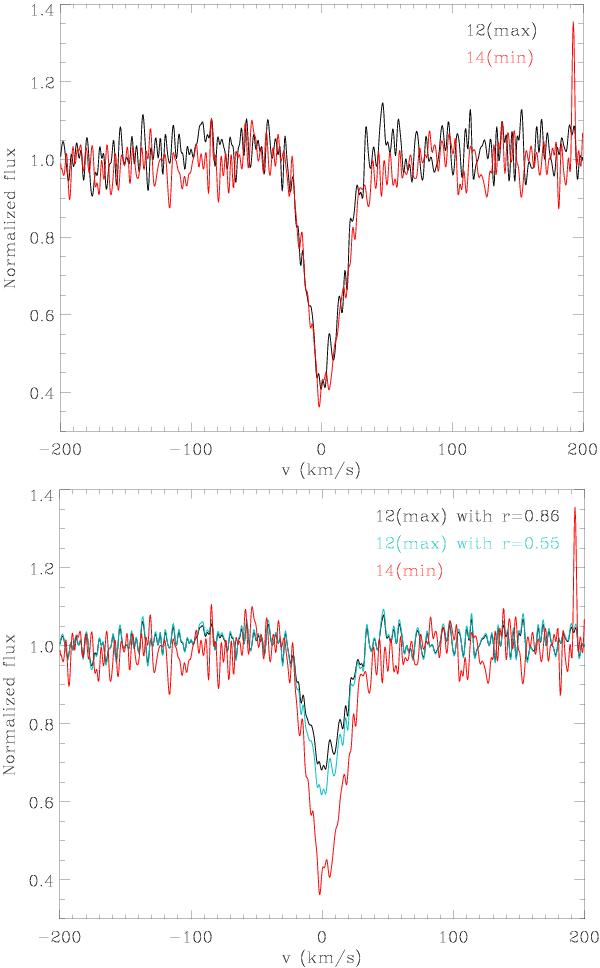
Comparison between LiI absorption lines observed on March 12 and 14, corresponding to photometric maximum and minimum. In the top plot there is no difference in line depth, showing that no veiling is detectable with brightness increase. In the bottom plot we added veiling to the spectrum at photometric maximum to demonstrate how a spot with temperature of 10 000 K and f = 5% would affect the line depth if it were the main cause of the observed photometric variations.
Current usage metrics show cumulative count of Article Views (full-text article views including HTML views, PDF and ePub downloads, according to the available data) and Abstracts Views on Vision4Press platform.
Data correspond to usage on the plateform after 2015. The current usage metrics is available 48-96 hours after online publication and is updated daily on week days.
Initial download of the metrics may take a while.