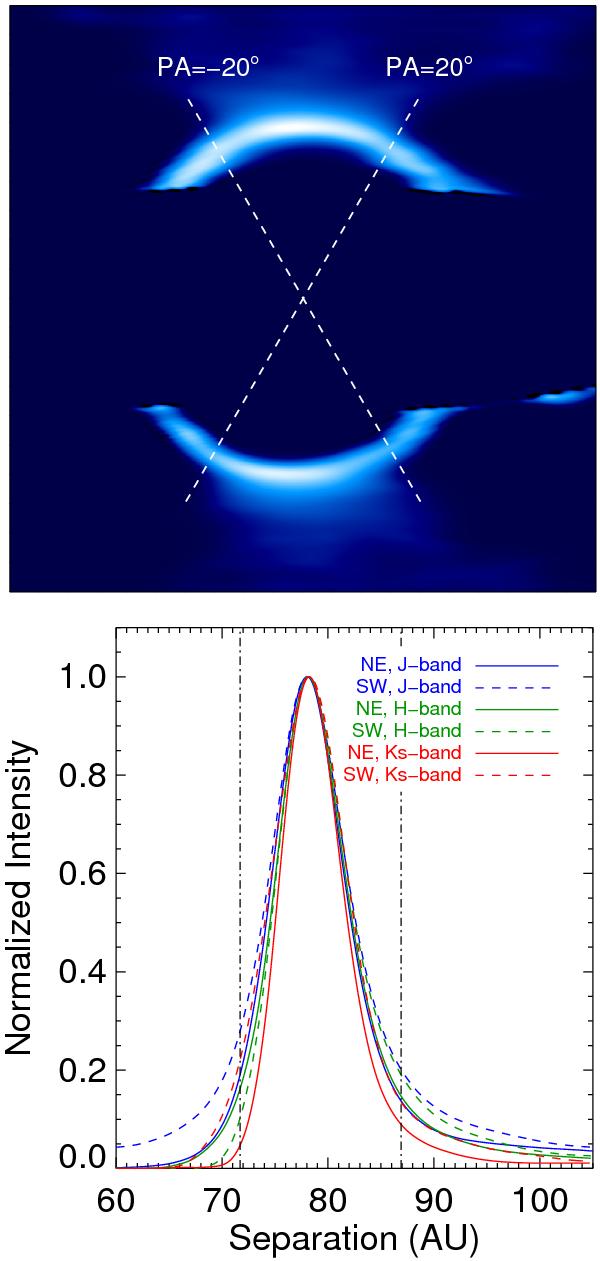
Fig. 9

Top: a de-projection of the deconvolved H-band reduced image, rotated to make the NE ansa point upwards. The inner, low signal-to-noise region of the ring is not shown here. Only the PA range within the two dashed lines is used to created the profiles to the right. Bottom: JHKs-band, normalized profiles of the deconvolved and de-projected ring, towards the NE and SW ansae, compared to the inner and outer edge estimates for the narrow-ring component in Wahhaj et al. (2005). See Table 6 to obtain these profiles as real numbers.
Current usage metrics show cumulative count of Article Views (full-text article views including HTML views, PDF and ePub downloads, according to the available data) and Abstracts Views on Vision4Press platform.
Data correspond to usage on the plateform after 2015. The current usage metrics is available 48-96 hours after online publication and is updated daily on week days.
Initial download of the metrics may take a while.


