Fig. 1
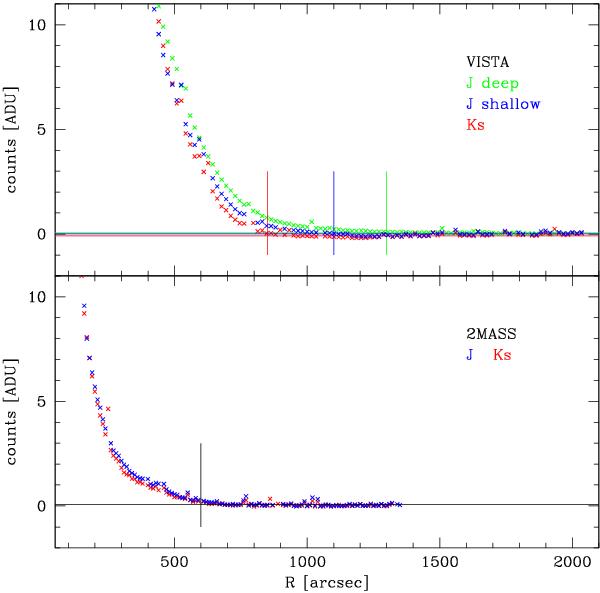
Azimuthally-averaged intensity profiles (counts) as a function of the semi-major axis for the VISTA (top panel) and 2MASS data of NGC 253, in both J (blue points) and Ks (red points) bands. For the VISTA data, the intensity profile is also derived for the deep J band image (green points). The vertical lines indicate the outer radii corresponding to the ellipse of the limiting surface brightnesses for the imaging data in each band. They are R = 600 arcsec for the 2MASS images in both J and Ks bands (black vertical line in the bottom panel), and R = 1034 arcsec and R = 830 arcsec, for the shallow VISTA data (top panel) in the J (blue vertical line) and Ks (red vertical line) bands respectively, while for the deep J band image it is at R = 1305 arcsec (green vertical line). The horizontal lines indicate the residual counts in the background, which are ~0.08 in the 2MASS images (black horizontal line), and ~− 0.08 in the Ks image (red horizontal line), ~0.002 and ~0.06 in the J shallow and deep images (blue and green horizontal lines) for the VISTA data.
Current usage metrics show cumulative count of Article Views (full-text article views including HTML views, PDF and ePub downloads, according to the available data) and Abstracts Views on Vision4Press platform.
Data correspond to usage on the plateform after 2015. The current usage metrics is available 48-96 hours after online publication and is updated daily on week days.
Initial download of the metrics may take a while.