Fig. 10
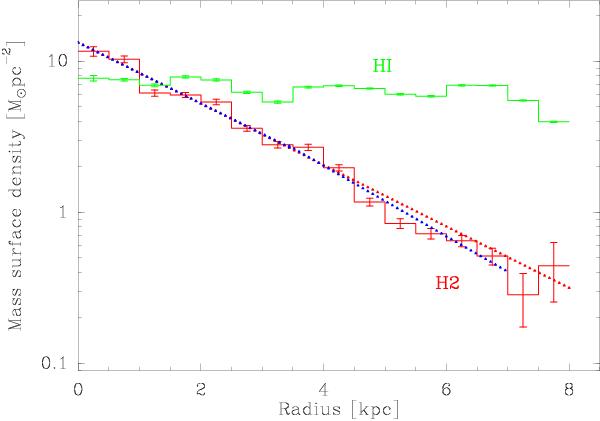
Radial distribution of the CO-derived H2 (red) and H i (green) mass surface density in M⊙ pc-2. The mass surface density is corrected for inclination and includes helium. The red dots correspond to an exponential fit to the first 7 kpc, yielding an exponential length of 2.1 kpc. The blue dots represent two partial fits: one for the inner galaxy (out to 3.5 kpc), and one for the outer galaxy (3.5 kpc <R< 7.0 kpc). Statistical error bars are derived from the rms scatter over the rings, as described in the 2nd paragraph of Sect. 3.3.
Current usage metrics show cumulative count of Article Views (full-text article views including HTML views, PDF and ePub downloads, according to the available data) and Abstracts Views on Vision4Press platform.
Data correspond to usage on the plateform after 2015. The current usage metrics is available 48-96 hours after online publication and is updated daily on week days.
Initial download of the metrics may take a while.