Fig. 14
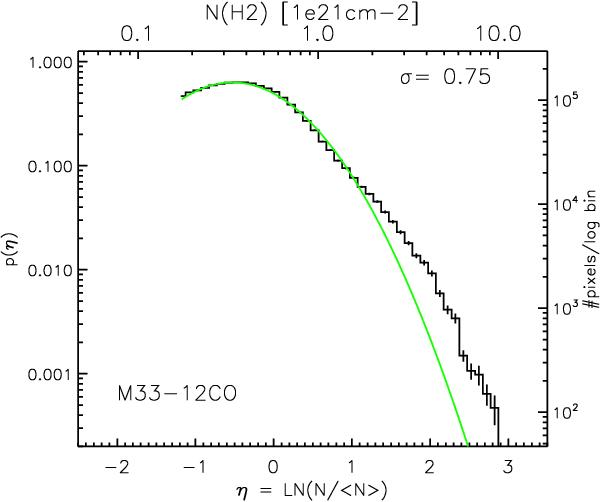
Probability distribution function of H2 column density of M 33. The column density was derived from all pixels in the CO map from Fig. 1, excluding only the noisy edges. The left y-axis gives the normalized probability p(η), the right y-axis the number of pixels per log bin. The upper x-axis is in units of H2 column density, and the lower x-axis is the logarithm of the normalized column density. The green curve indicates the fitted PDF. The dispersion of the fitted PDF is indicated by σ.
Current usage metrics show cumulative count of Article Views (full-text article views including HTML views, PDF and ePub downloads, according to the available data) and Abstracts Views on Vision4Press platform.
Data correspond to usage on the plateform after 2015. The current usage metrics is available 48-96 hours after online publication and is updated daily on week days.
Initial download of the metrics may take a while.