Fig. 2
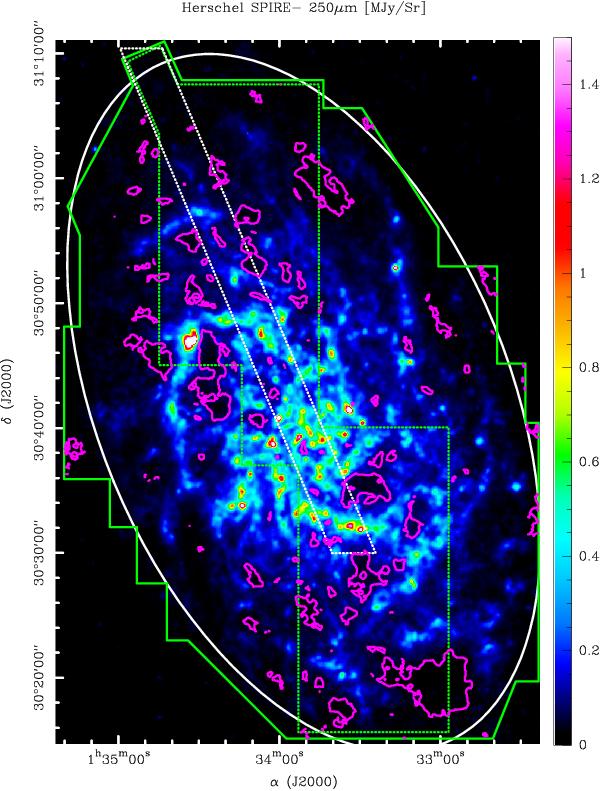
Triangulum galaxy M 33. This image shows in plain green the edges of the coverage of the CO(2–1) survey on top of a Herschel 250 μm map (Xilouris et al. 2012) that traces cold dust. The green dotted limits correspond to the previous processed area in Gratier et al. (2010b). The 2′×40′ wide HerM33es strip, in white dots, is also the region where the CO(1–0) transition has been observed with the 30 m telescope. The purple limited areas (white lines in Fig. 1) are the H i-poor regions where we detect no H i above 10 K and inside which we can see that there is no strong 250 μm emission. The white ellipse represents a 7.2 kpc radius from the center.
Current usage metrics show cumulative count of Article Views (full-text article views including HTML views, PDF and ePub downloads, according to the available data) and Abstracts Views on Vision4Press platform.
Data correspond to usage on the plateform after 2015. The current usage metrics is available 48-96 hours after online publication and is updated daily on week days.
Initial download of the metrics may take a while.