Fig. 4
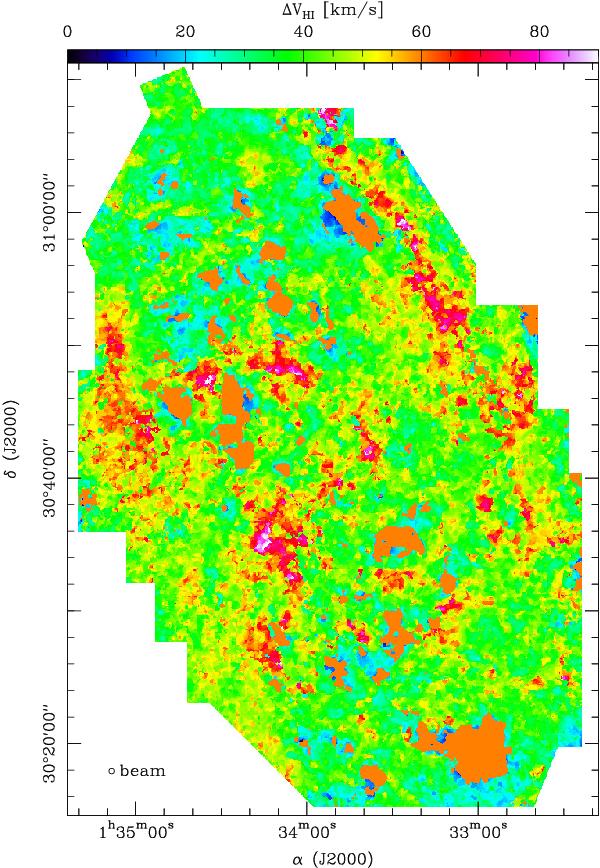
Map of the window width used in the reduction process, in km s-1, corresponding to the H i based mask used in the baselining process and in the integrated intensity maps computing. Orange regions show areas where no H i is detected, and where the window is thus equal to 60 km s-1. The 25″×25″ beam size for H i data is shown in the lower left corner.
Current usage metrics show cumulative count of Article Views (full-text article views including HTML views, PDF and ePub downloads, according to the available data) and Abstracts Views on Vision4Press platform.
Data correspond to usage on the plateform after 2015. The current usage metrics is available 48-96 hours after online publication and is updated daily on week days.
Initial download of the metrics may take a while.