Fig. 5
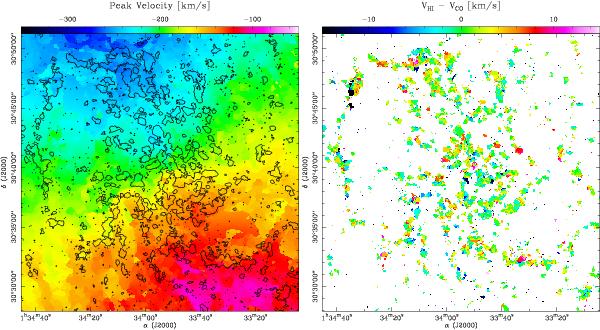
Left panel. CO velocity field (black-contoured) on top of H i velocity field map. Inside the black contours the colors represent the CO velocity, while outside they correspond to the H i velocity. The CO velocity is determined by the velocity of the line peak for 4σ detections. This map shows that the CO and the H i peak line temperature are detected at very similar velocities. Right panel. H i-CO velocity shift for the regions where CO velocity is determined. The shift is maximal in NGC604 (α = 13432, δ =+30°47′00′′(J2000)), where the dynamics of the gas is important.
Current usage metrics show cumulative count of Article Views (full-text article views including HTML views, PDF and ePub downloads, according to the available data) and Abstracts Views on Vision4Press platform.
Data correspond to usage on the plateform after 2015. The current usage metrics is available 48-96 hours after online publication and is updated daily on week days.
Initial download of the metrics may take a while.