Fig. 9
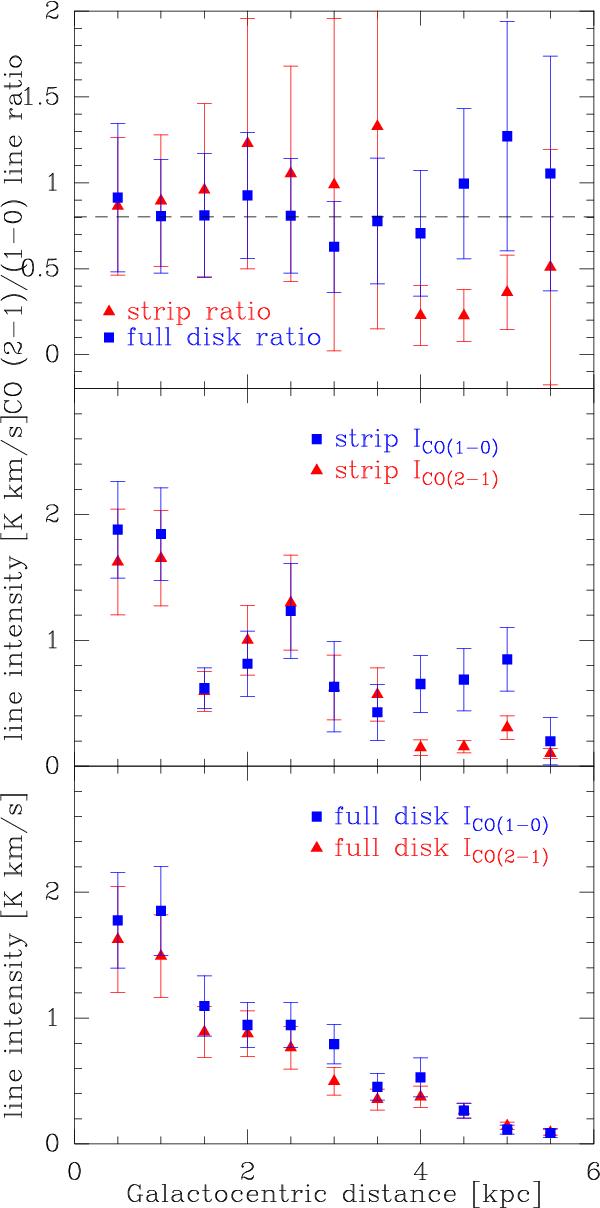
Top: line ratios along the HerM33es strip (triangles) and for annuli of 0.5 kpc width (stars). The dashed line represents the 0.8 value we assume for the ratio in this paper. Middle: radial evolution of the CO(2–1) and CO(1–0) line intensity along the strip. Bottom: radial evolution of the CO(2–1) and CO(1–0) line intensity for the full disk. For all panels, strip CO(1–0) data is described in Sect. 2.4, and disk CO(1–0) data is taken from Rosolowsky et al. (2007). Error bars are derived from statistical and calibration uncertainties and are described in the 2nd paragraph of Sect. 3.2.
Current usage metrics show cumulative count of Article Views (full-text article views including HTML views, PDF and ePub downloads, according to the available data) and Abstracts Views on Vision4Press platform.
Data correspond to usage on the plateform after 2015. The current usage metrics is available 48-96 hours after online publication and is updated daily on week days.
Initial download of the metrics may take a while.