Fig. 1
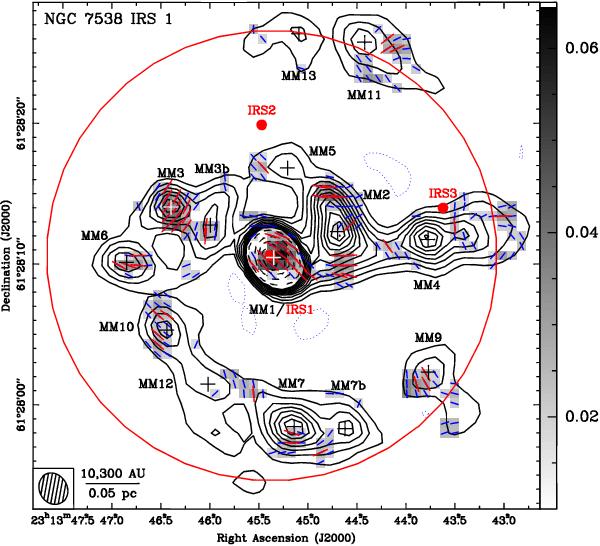
Contour map of the SMA dust continuum emission map towards NGC 7538 IRS 1 at 878 μm overlapped with the gray image of the polarized intensity. The blue and red segments show the magnetic field direction obtained from the polarization data with cutoff at rms of 2 and 3σ, respectively (see Sect. 3.2). Solid contours go from 3σ to 33σ in steps of 3σ, where σ = 0.017 Jy beam-1 is the rms noise of dust continuum. The dashed contours around IRS 1 (MM1) go from 50σ to 300σ in steps of 50σ. The scale of the polarized intensity image is shown in the righthand side of the figure (the units are Jy beam-1). The black and white crosses show the peak positions of the dust continuum sources (Table 1). The name of the dust continuum sources are also shown. Red circles mark the positions of IRS 1−3. The solid circle shows the FWHM of the SMA primary beam at the observed frequency. The physical scale of the map and synthesized beam are shown in the bottom left corner of the panel.
Current usage metrics show cumulative count of Article Views (full-text article views including HTML views, PDF and ePub downloads, according to the available data) and Abstracts Views on Vision4Press platform.
Data correspond to usage on the plateform after 2015. The current usage metrics is available 48-96 hours after online publication and is updated daily on week days.
Initial download of the metrics may take a while.