Fig. 2
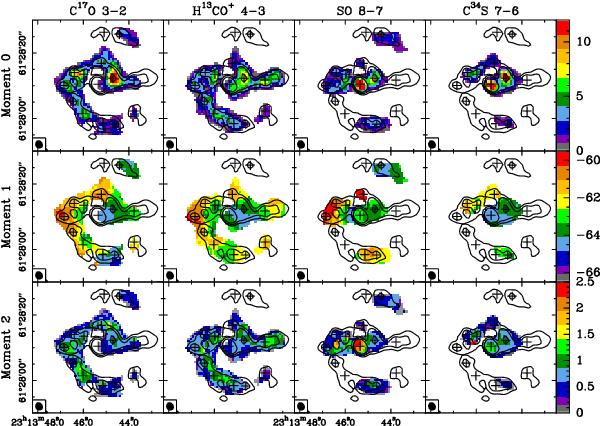
Moment maps of molecular transitions with extended emission. Rows: moments 0, 1, and 2, in descending order, labeled on the lefthand side of the figure. Columns: from left to right, C17O 3−2, H13CO+ 4−3, SO 8−7, and C34S 7−6, respectively, labeled on the top of the figure. Color map: moment maps. Common scale is shown on the righthand side of the figure. Contours: 3σ, 9σ, and 27σ continuum emission levels, where σ = 0.017 Jy beam-1.
Current usage metrics show cumulative count of Article Views (full-text article views including HTML views, PDF and ePub downloads, according to the available data) and Abstracts Views on Vision4Press platform.
Data correspond to usage on the plateform after 2015. The current usage metrics is available 48-96 hours after online publication and is updated daily on week days.
Initial download of the metrics may take a while.