Fig. 3
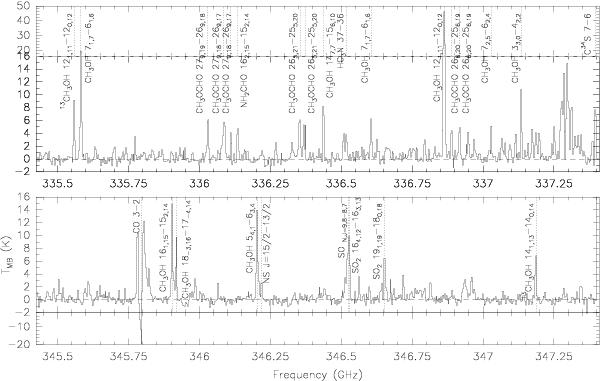
Spectrum toward the MM1 peak. Top panel: lower side band. Bottom panel: upper side band. A common temperature range from −2 to 14 K is displayed for better visualization. Additional temperature ranges are shown for the upper (−2 to −20 K) and lower (14 to 42 K) sidebands to display the entire spectrum. A dashed lines marks the 0 K level. For both sidebands, the frequencies of the main molecular transitions are noted by a dotted vertical line and the transition is specified.
Current usage metrics show cumulative count of Article Views (full-text article views including HTML views, PDF and ePub downloads, according to the available data) and Abstracts Views on Vision4Press platform.
Data correspond to usage on the plateform after 2015. The current usage metrics is available 48-96 hours after online publication and is updated daily on week days.
Initial download of the metrics may take a while.