Fig. 5
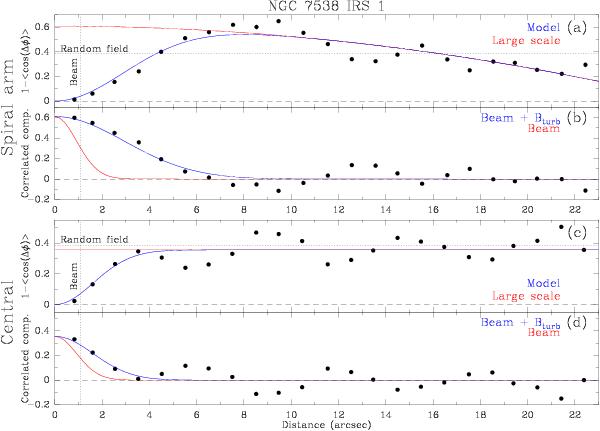
Angular dispersion function of the magnetic field segments detected toward the spiral arm (panels a) and b) and the central region (panels c) and d)). Top subpanels (a) and c)): dots represent the data with uncertainty bars, dashed line marks the zero value, dotted vertical line notes the beam size, dotted horizontal line shows the expected value for a randomic magnetic field, red line shows the best fit to the large-scale magnetic field (summation in Eq. (2)), and blue line shows the best fit to the data (Eq. (2)). Bottom subpanels (b) and d)): dots represent the correlated component of the best fit to the data, dashed line marks the zero value, dotted vertical line notes the beam size, red line shows the correlation due to the beam, and blue line shows the correlation due to the beam and the turbulent component of the magnetic field.
Current usage metrics show cumulative count of Article Views (full-text article views including HTML views, PDF and ePub downloads, according to the available data) and Abstracts Views on Vision4Press platform.
Data correspond to usage on the plateform after 2015. The current usage metrics is available 48-96 hours after online publication and is updated daily on week days.
Initial download of the metrics may take a while.