Fig. 6
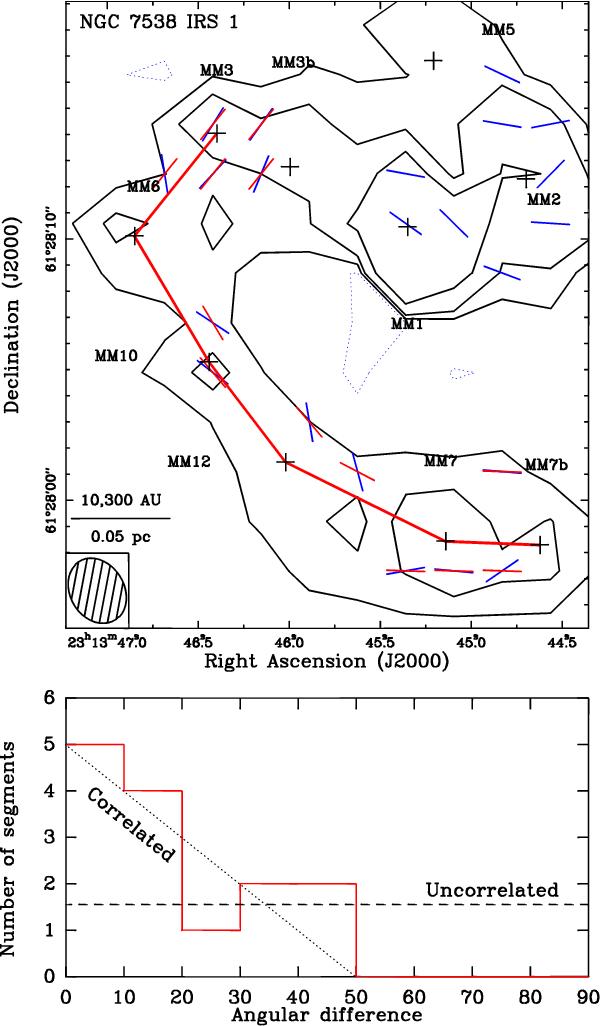
Comparison of the dusty filament orientation to the magnetic field segments orientation toward NGC 7538 IRS 1. Pixels have been resized to the beam size to ensure statistical independence (see Fig. 1 for Nyquist sampling). Top panel: contours are 3, 9, and 27 times 0.02 Jy beam-1 continuum emission levels. Blue segments are derived as for Fig. 1. The red thick line is the axis of the filament (see Sect. 4.3). Red segments show the orientation of the filament corresponding to each pixel with polarization detection. Bottom panel: histogram of the angle difference between the polarization segment and the filament axis for each pixel. The correlated and uncorrelated distributions used for the χ2 test in Sect. 4.3 are shown as dotted and dashed lines, respectively.
Current usage metrics show cumulative count of Article Views (full-text article views including HTML views, PDF and ePub downloads, according to the available data) and Abstracts Views on Vision4Press platform.
Data correspond to usage on the plateform after 2015. The current usage metrics is available 48-96 hours after online publication and is updated daily on week days.
Initial download of the metrics may take a while.