Fig. 7
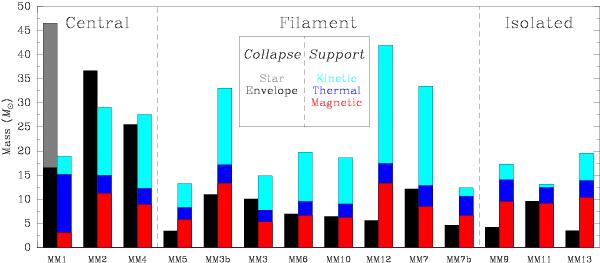
“Mass balance” analysis. Comparison of the measured mass to the maximum supported mass by different forces. Cores are ordered according to their location in the central massive structure, in the filament, or isolated. Black: measured mass from continuum maps. Gray: mass of the star embedded in the MM1 clump. Red: mass supported by magnetic fields assuming a uniform value across the source. Light and dark blue: mass supported by virialized gas motions due to internal dynamics and thermal dispersion, respectively.
Current usage metrics show cumulative count of Article Views (full-text article views including HTML views, PDF and ePub downloads, according to the available data) and Abstracts Views on Vision4Press platform.
Data correspond to usage on the plateform after 2015. The current usage metrics is available 48-96 hours after online publication and is updated daily on week days.
Initial download of the metrics may take a while.