Fig. 8
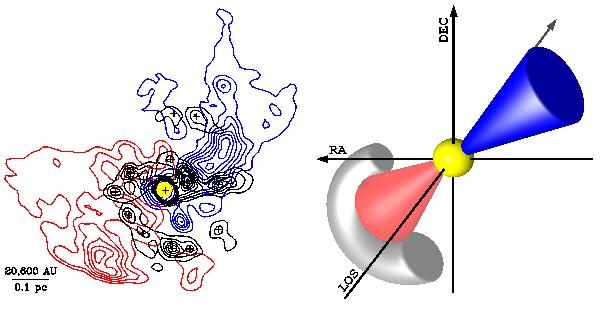
Left panel: overlayed contours for dust continuum (gray, this work), and blue− and redshifted 13CO 2−1 outflow (blue and red, QZM11). Crosses mark the positions for dusty cores and red dots for IR sources. Right panel: schematic 3D cartoon of the proposed scenario for the NGC 7538 IRS 1−3 complex (Sect. 5.3). Yellow sphere represents MM1, blue and red cones represent the blue and red outflow lobes, and the gray structure represents the spiral arm. Faded colors represent the structures behind MM1 in the LOS direction.
Current usage metrics show cumulative count of Article Views (full-text article views including HTML views, PDF and ePub downloads, according to the available data) and Abstracts Views on Vision4Press platform.
Data correspond to usage on the plateform after 2015. The current usage metrics is available 48-96 hours after online publication and is updated daily on week days.
Initial download of the metrics may take a while.