Free Access
Fig. 1
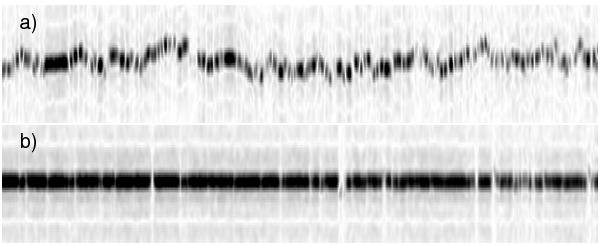
Waterfall plot of MIDI observations without (upper plot) and with FSU-A (lower plot) as an external fringe tracker. The horizontal axis can be interpreted as time, the vertical axis as OPD. Both plots display 2.5 min of observations.
Current usage metrics show cumulative count of Article Views (full-text article views including HTML views, PDF and ePub downloads, according to the available data) and Abstracts Views on Vision4Press platform.
Data correspond to usage on the plateform after 2015. The current usage metrics is available 48-96 hours after online publication and is updated daily on week days.
Initial download of the metrics may take a while.