Fig. 10
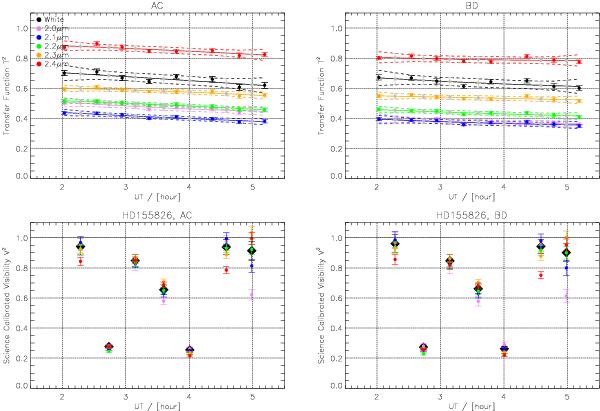
Upper plots: transfer functions T2 for “AC” and “BD” for each spectral pixel and calibrator observation. The values for the individual spectral pixels are color-coded with respect to their corresponding wavelength (see legend in the upper left). The dashed lines are the corresponding 95% confidence intervals of the polynomial fits shown as solid lines. They gray data points are the computed T2 values for the time of the science observation. Lower plots: calibrated visibilities for each spectral pixel.
Current usage metrics show cumulative count of Article Views (full-text article views including HTML views, PDF and ePub downloads, according to the available data) and Abstracts Views on Vision4Press platform.
Data correspond to usage on the plateform after 2015. The current usage metrics is available 48-96 hours after online publication and is updated daily on week days.
Initial download of the metrics may take a while.